Emerging Markets Strategy 28 October 2020
- As EM exports return to pre-pandemic levels, countries’ performances (measured as share of the total) have diverged significantly.
- The differences reflect export performance in terms of price (including FX effects) and volume (i.e., supply changes affected by the pandemic), as well as shifting global demand for certain products.
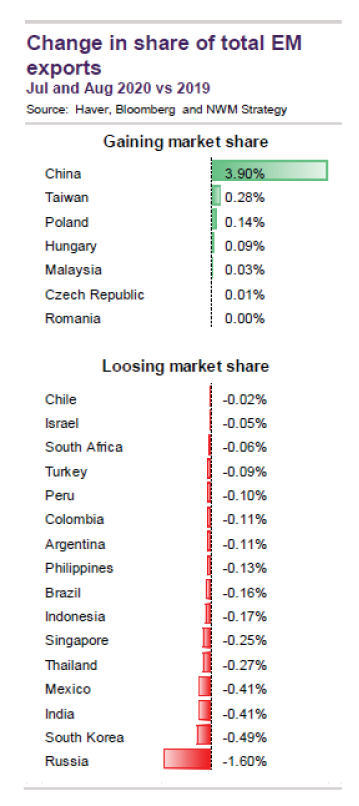
- China has been by far the greatest beneficiary, followed by Taiwan and Poland. On the other hand, Russia (due to oil), Korea, India and Mexico have retraced the most. The big FX under-performers (TRY, BRL, ARS) have not seen a significant export boost.
Last week (here) we introduced our analytical framework to rank countries according to the magnitude of their combined stimulus efforts in response to the pandemic. Today we examine what has taken place in terms of export performance, a key indicator for the sustainability and strength of each country’s recovery. Previously, we analysed the health of the external accounts across EM countries, as well as the implications for FX valuations (here).
In this piece we do something simpler: we rank which countries have gained and which ones have lost market share of total EM exports (focusing on the largest 23 EM exporters). We think the metric will gain importance as global demand stabilizes.
We take the average for July and August and compare it the same period last year as our measure of the shifts in implied competitiveness that have taken place since the onset of the pandemic. The results are presented on the table to the left. Given that they are shares of the total, the gains in some countries have to come from losses in others. The absolute change in the share also reflects the relative size of the countries’ exports, so in some cases the absolute number is less relevant.
We think this is a nice way to summarize the different factors that have affected exports:
- Direct changes in export prices, which is most notable for highly concentrated commodity producers;
- Supply side shocks as some countries have had a harder time bringing production back up;
- Changes in the product composition of global demand (more industrial and medical products, for example), some of which might be structural in nature;
- Importantly, the impact of relative FX changes compared to competitors.
This also controls for the overall level of global export production, as they are measured as relative market shares. It also highlights changes that could outlive the pandemic, given that shifts in market shares tend to have some lasting effects. We have shown this for the case of Mexican competitiveness in the US import market over the past few years (details here).
China and industrial exporters are gaining ground…
The clearest conclusion is China’s significant increase in EM export market share in just the span of a few months, from around 36% in the summer of 2019 to slightly more than 40% this year. Indeed, this is the highest Chinese market share in a while, which holds for different time samples following the pandemic. This is the result of a much more resilient production chain as contagion rates have been significantly lower than in the rest of EM, as well as more global demand for specific (medical) products, especially at the onset of the virus.
Even if this edge vs the rest of EM narrows over the next few months, it will have significant longer-term implications, as it shows China’s ability to capture market share despite FX appreciation against most competitors.
The two other economies that have gained absolute market shares are Taiwan and Poland. The absolute values are smaller given their smaller exports, but they are very telling of their capacity to gain a slice of the global market. Both countries’ main exports are concentrated on industrial equipment (electronics, machinery, cars, etc.), which have been very resilient during the past few months.
Their gains are interesting compared to Mexico’s loses, even as the MXN has depreciated more than both throughout the pandemic. Indeed, Mexico’s share of the US market has increased in the same period, but hasn’t been enough to compensate for the rest of the world. At face value, it demonstrates that export destination and position in the value chain plays a key role, although crude oil exports also have depressed Mexico’s overall export value.
… at the expense of commodity producers and a few Chinese competitors
Russia is the EM country with the largest decrease in export shares as crude prices remain significantly lower than last year. It has lost about 1.6% of the total EM market – from 5.6% to 4%, accounting for a large chunk of China’s gain. This alone has important implications for the rebalancing of the global economy after the pandemic (remember that we’re talking about a $6.7tr market over the past 12 months). Mexico and Colombia’s declines (much smaller due to their absolute size) fall exactly under the same category.
The loss of market share by Korea and India are noteworthy. Korea’s export basket is similar to Taiwan and Poland (largest categories are electronics, machinery and vehicles), but it has been unable to keep up with those competitors. For reference,
Korea’s most recent exports have declined by almost 3% YoY, while they have increased by 1.5% in Taiwan and Poland. India’s export basket is a lot more diversified than the rest, and is perhaps a case where the relative currency strength (in real effective terms) could be playing a role.
Finally, the big FX underperformers have not seen any improvement in export competitiveness. Turkey, Argentina and Brazil score relatively poor despite their significant depreciations, which have been more effective in compressing imports.
Brazil and Argentina’s performance reflects their export concentration on few commodities even as their terms of trade have improved. Turkey’s exports reach across more products, but industrial goods have contracted over the past few months. While the trade balances have shown some improvements, this is an important lesson in the modest effects of weaker FX to boost competitiveness even in the short-term.
Strategists: Alvaro Vivanco, Head of LatAm Strategy and Macro Analysis +1 203 897 4896 alvaro.vivanco@natwestmarkets.com
www.agilemarkets.com Bloomberg: NWMR<GO>
This is Non-Independent Research, as defined by the Financial Conduct Authority. Not intended for Retail Client distribution. This material should be regarded as a marketing communication and may have been produced in conjunction with the NatWest Markets Plc trading desks that trade as principal in the instruments mentioned herein. All data is accurate as of the report date, unless otherwise specified.
All data is accurate as of the report date, unless otherwise specified.
This communication has been prepared by NatWest Markets Plc, NatWest Markets N.V. (and/or any branches) or an affiliated entity (“NatWest Markets”), and should be regarded as a Marketing Communication, for which the relevant competent authority is the UK Financial Conduct Authority.
Please follow the link for the following information https://www.natwestmarkets.com/natwest-markets/regulation/mar-disclosures.html:
MAR Disclaimer
Conflicts of Interest statement
Glossary of definitions
Historic Trade ideas log
This material is a Marketing Communication and has not been prepared in accordance with the legal and regulatory requirements designed to promote the independence of investment research and may have been produced in conjunction with the NatWest Markets trading desks that trade as principal in the instruments mentioned herein. This commentary is therefore not independent from the proprietary interests of NatWest Markets, which may conflict with your interests. Opinions expressed may differ from the opinions expressed by other business units of NatWest Markets. The remuneration of the author(s) is not directly tied to any transactions performed, or trading fees received, by any entity of the NatWest Group, for example, through the use of commission-based remuneration.
This material includes references to securities and related derivatives that the firm's trading desk may make a market or provide liquidity in, and in which it is likely as principal to have a long or short position at any time, including possibly a position that was accumulated on the basis of this analysis material prior to its dissemination. Trading desks may also have or take positions inconsistent with this material. This material may have been made available to other clients of NatWest Markets before it has been made available to you and is not subject to any prohibition on dealing ahead of its dissemination. This document has been prepared for information purposes only, does not constitute an analysis of all potentially material issues and is subject to change at any time without prior notice. NatWest Markets does not undertake to update you of such changes. It is indicative only and is not binding. Other than as indicated, this document has been prepared on the basis of publicly available information believed to be reliable but no representation, warranty, undertaking or assurance of any kind, express or implied, is made as to the adequacy, accuracy, completeness or reasonableness of this material, nor does NatWest Markets accept any obligation to any recipient to update, correct or determine the reasonableness of such material or assumptions contained herein. NatWest Markets and each of its respective affiliates accepts no liability whatsoever for any direct, indirect or consequential losses (in contract, tort or otherwise) arising from the use of this material or reliance on the information contained herein. However this shall not restrict, exclude or limit any duty or liability to any person under any applicable laws or regulations of any jurisdiction which may not lawfully be disclaimed. The opinions, commentaries, projections, forecasts, assumptions, estimates, derived valuations and target price(s) or other statements contained in this communication (the “Views”) are valid as at the indicated date and/or time and are subject to change at any time without prior notice. NatWest Markets does not undertake to update you of such changes. Views expressed herein are not intended to be, and should not be viewed as advice or as a personal recommendation. The Views may not be objective or independent of the interests of the authors or other NatWest Markets trading desks, who may be active participants in the markets, investments or strategies referred to in this material. NatWest Markets will not act and has not acted as your legal, tax, regulatory, accounting or investment adviser; nor does NatWest Markets owe any fiduciary duties to you in connection with this and/or any related transaction and no reliance may be placed on NatWest Markets for investment advice or recommendations of any sort. You should make your own independent evaluation of the relevance and adequacy of the information contained in this document and make such other investigations as you deem necessary, including obtaining independent financial advice, before participating in any transaction in respect of the securities referred to in this document. This document is not intended for distribution to, or use by any person or entity in any jurisdiction or country where such distribution or use would be contrary to local law or regulation. The information contained herein is proprietary to NatWest Markets and is being provided to selected recipients and may not be given (in whole or in part) or otherwise distributed to any other third party without the prior written consent of NatWest Markets.
NatWest Markets and its respective affiliates, connected companies, employees or clients may have an interest in financial instruments of the type described in this document and/or in related financial instruments giving rise to potential conflicts of interest which may impact the performance of such financial instruments. Such interests may include, but are not limited to, (a) dealing in, trading, holding or acting as market-maker or liquidity provider in such financial instruments and any reference obligations; (b) entering into hedging strategies on behalf of issuer clients and their affiliates, investor clients or for itself or its affiliates and connected companies; and (c) providing banking, credit and other financial services to any company or issuer of securities or financial instruments referred to herein. NatWest Markets and its affiliates, connected companies, employees or clients may at any time acquire, hold or dispose or long or short positions (including hedging and trading positions) which may impact the performance of a financial instrument.
In the U.S., this Marketing Communication is intended for distribution only to major institutional investors as defined in Rule 15a-6 of the U.S. Securities Exchange Act 1934 (excluding documents produced by our affiliates within the U.S. which are subject to the following disclaimer https://www.agilemarkets.com/api/ds/v1/disclaimer/publication/2756). Any U.S. recipient wanting further information or to effect any transaction related to this trade idea must contact NatWest Markets Securities Inc., 600 Washington Boulevard, Stamford, CT, USA. Telephone: +1 203 897 2700.
Where communicated in Singapore, this communication may be deemed an advertisement. This advertisement has not been reviewed by the Monetary Authority of Singapore.
NatWest Markets Plc is authorised by the Prudential Regulation Authority and regulated by the Financial Conduct Authority and Prudential Regulation Authority and is provisionally registered as a swap dealer with the United States Commodity Futures Commission. NatWest Markets N.V. is incorporated with limited liability in the Netherlands, authorised and regulated by De Nederlandsche Bank and the Autoriteit Financiële Markten. It has its seat at Amsterdam, the Netherlands, and is registered in the Commercial Register under number 33002587. Registered Office: Claude Debussylaan 94, Amsterdam, The Netherlands. Branch Reg No. in England BR001029. Agency agreements exist between different members of NatWest Group. Securities business in the United States is conducted through NatWest Markets Securities Inc., a FINRA registered broker-dealer (http://www.finra.org), a SIPC member (www.sipc.org) and a wholly owned indirect subsidiary of NatWest Markets Plc. NatWest Markets Securities Inc. is authorised by NatWest Markets Plc to act as its agent for certain kinds of its activities.
For further information relating to materials provided by NatWest Markets, please view our Agile Markets Terms and Conditions
Copyright ©NatWest Markets Plc. All rights reserved.
Version 22.07.2020